
On February 23rd, NACUBO1 released its annual statistic of US Endowment returns for the fiscal year 2022 on its website2. Once again, numbers stood out, with losses being lower than what could have been expected from the performance of broad equity and bond markets.
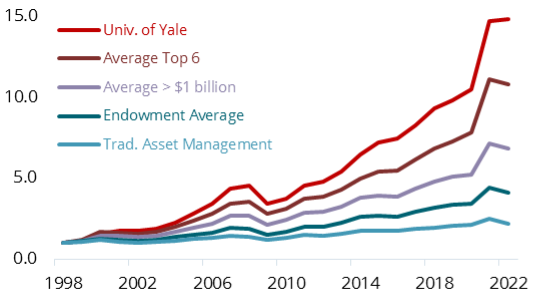
Exhibit 1: Endowment Reurns, 07/1998 – 06/2022
Endowments are one of the oldest classes of institutional investors, and we believe they are interesting role models. For those inclined to take notice of longer-term developments – and we do count ourselves into that group – their investment returns provide an interesting benchmark. Investors of all kinds might want to consider.
Exhibit 1 summarizes data we have collected over the years. It shows the development of $1 hypothetical dollar invested on June 30th, 1998. In addition to endowments of different sizes, we show our proxy for traditional asset management3. Two observations stand out from the chart:
- Large endowments have outperformed smaller ones, by a significant margin
- All endowments have outperformed traditional 50:50 equity – bond portfolios.
On the following pages, we discuss the following: Why have endowments achieved these results, and what can we learn from them? And: How does the Lansdowne Endowment Fund take advantage of these insights?
The Endowment Style of Investing
Endowments originated in 17th-century England, when the colleges of Oxford and Cambridge University received gifts to support their operations and ensure their independence. Because these donations were meant to sustain an institution, which otherwise has no income, the recipient colleges became the ultimate long-term investors. Their investment purpose is to effectively preserve for future generations the university’s ability to serve society by creating knowledge.
The investment style of these institutions has been researched and documented repeatedly, most recently in a paper published 2020 in the Financial Analysts Journal4. According to the authors, the following are the key pillars of their success:
- A truly long-term focus, leading to an ability to bear elevated levels of risk.
- Broad diversification across traditional and alternative asset classes.
- Early adoption of new asset classes as they become investable (early mover advantage – e.g., an early move into equities from the mid-1930s onwards, later a move into hedge funds between 1980-2000 and private equity between 1990-2010)
- The ability to behave in a counter-cyclical fashion; the authors of the above-mentioned study were able to show in particular that, as a class of investors, large endowments actually decreased their equity allocation in the run-up to major stock market crises, and later increased it in the aftermath.
- Lastly, while many other investors have adopted factor investing and moved from active to passive strategies, the leading university endowments have largely abstained from these trends, and stuck with active asset management.
Risk-adjusted Returns
US Endowments have outperformed traditional 50:50 portfolios, even before accounting for costs5. However, when it comes to investing, we always need to consider risk as well as the return. This old adage is particularly relevant when analysing endowment returns. Since 1998, the annual return of US endowments has displayed a volatility of 10.5%. For large (>$1 billion) endowments, that number has reached 12.2%; and the large Ivy-league endowments have exhibited an annual volatility of 13-15%.
Exhibit 2: Endowment Returns.Versus-Risk Analysis
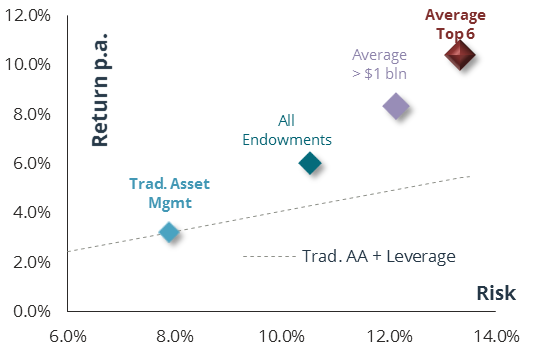
Therefore, exhibit 2 provides a fairer comparison, summarizing the last 24 years of investment results by comparing both risk and return. We can see clearly now that endowments have provided their superior results by employing substantially more risk than a 50:50 portfolio; but their returns cannot be accounted for because of risk alone: The dotted line in the chart shows that, even at equivalent levels of risk, traditional asset management would not have provided the same level of returns.
Endowment Investing – the “UCITS” way
Can endowment returns be replicated in a liquid, daily-tradable format? To answer this question, let’s dissect the aforementioned list of characteristics of endowment investing, taking each in turn:
- Long-term focus. Although the Endowment Fund is just over 3 years old, the set of rules governing its asset structure has been designed with the long-term in mind. The main factor determining its return – the strategic asset allocation – is based on 7-year models. It is determined using risk metrics that are calculated over the longest possible time horizon, employing 3-, 6- and 12-month periods rather than just monthly or weekly statistics.
- Broad diversification. The Endowment Fund uses all possibilities available under its mandate to reach for idiosyncratic sources of return. In total, 17 asset classes encompassing roughly 130 countries are covered by its investment process.
- Early adoption of new asset classes. We keep an open mind when integrating non-traditional asset classes into the portfolio. Allocations to “niche” asset classes like convertibles, frontier market equities or insurance-linked securities are set based on a stringent, mathematical process. No ‘conventional thinking’ is allowed to influence these allocations.
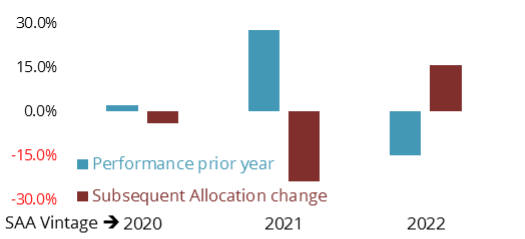
- Counter-cyclical focus. Because our allocations are based on forward-looking, valuation-based models, strong performance of a particular asset class is more likely than not to trigger a downward adjustment in our expectations the following year. With lower return expectations, allocations will be revised downwards. Thereby, an element of sell-high, buy-low is entering the process. Exhibit 3 provides an example, showing that our allocation to convertible bonds has been adjusted in the opposite direction of the performance leading up to the revision repeatedly now.
- Active management. Our implementation relies heavily on active managers, with a sufficiently long track record, whose investment approaches have been studied and vetted by our team. The results have been encouraging (Exhibit 4).
Exhibit 4: Active Management – vs Peer Groups
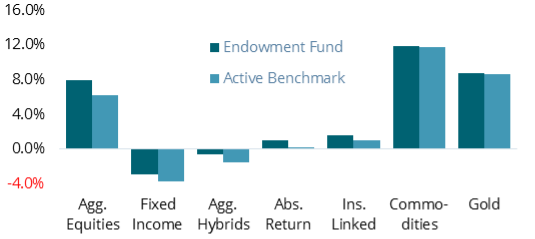
Exhibit 3: Convertibles – Allocation vs. Performance
Lastly, it is important to also mention the differences in replicating this investment style via a UCITS fund. The most important one concerns the level of risk. The majority of the asset classes we employ does not provide enough risk to match the volatility exhibited by large endowment portfolios. At the same time, UCITS prevents the explicit use of leverage. Therefore, the Endowment Fund is targeting the best possible return at the same risk as the traditional asset management proxy we show on the previous pages.
The second difference comes from the UCITS liquidity requirement. UCITS regulation prevents the Endowment Fund from accessing private, illiquid markets, which make up a significant part of ordinary endowment portfolios. Instead, we invest into listed real estate, listed infrastructure and listed private equity. This deviation has two consequences:
- Differences in short-term performance: because of daily price discovery that comes with liquid assets, listed markets are always ahead of private markets at the turn of capital market cycles. Private market valuations, on the flip side, tend to correct 1-2 quarters later, and are also much slower to recover. We can observe this from carefully observing Exhibit 1: the larger endowments, with their much higher allocation in illiquid asset classes, have shown more resilience in FY2022 – but will also be vulnerable to mark-downs in FY2023, in our opinion.
- Differences in long-term performance: there is a perception that in the long run, private markets offer a higher performance due to informational advantages, manager skill and an ill-defined concept called “illiquidity risk premium”. We are sceptical of this view. Economically, we access the same underlying asset classes through the listed corporations we have exposure to. Over time, the entities that make up the listed sector have gained access to some of the highest quality assets in their respective markets. They are also employing leverage, much as is the case with private equity funds. Third, accessing real assets through the listed market involves much lower fees as compared to closed-end partnerships6. Lastly, the existence of an illiquidity risk premium is unproven, and disputed among academics.
In summary, the lack of access to private markets does change the nature of the investment, to an extent. In the short-term, it will lead the Endowment Fund to behave more like a public-market investment than a classical illiquid endowment portfolio. However, over the long-term, any differences in return are more likely to be caused by different levels of risk-taking than anything else.
1 NACUBO = National Association of College and University Business Officers. See www.nacubo.org for details.
2 Endowments generally have a fiscal year ending in June, and publicize their returns as of that date, all performance numbers we discuss in the following are as of June 30th, 2022
3 We use an index made up of 50% global equities and 50% global bonds, subtracting 1.0% p.a. for costs and fees
4 Seventy-Five Years of Investing for Future Generations, Financial Analysts Journal/ CFA Institute, 2020.
5 Investors in traditional stock/bond portfolios face implementation costs in the form of management fees, custodian fees and transaction fees. We subtract 1.0% p.a. in order to acknowledge this fact. We believe this is fair given that endowment returns are also reported after deducting operating costs.
6 One survey, performed by CEM Benchmarking and published by McKinsey (2017) and later Døskeland-Strömberg in a 2018 study, estimated total all-in fees for a sample of 122 private equity funds to be 5.9% p.a. – consisting of 2.7% in management fees, 1.9% in carry and 1.2% in other fees.
Martin Friedrich is portfolio manager of the Lansdowne Endowment Fund and Head of Research. He joined Lansdowne Partners Austria in January 2019 from HQ Trust, one of the largest independent multi-family offices in Germany. Mr. Friedrich had been employed there since 2009, most recently as Head of Capital Markets Research and Co-Chief Investment Officer. Additionally, he managed client portfolios and was responsible for the investment process of LIQID, a fintech company in Berlin.

Related Articles:
Photo:Pixabay