
The banknote pictured, with a nominal value of 100 trillion, comes from a trip to Africa. It was printed in late 2008 and had a value of only $30 at the time. It is a vivid reminder of how hyperinflation can destroy an economy. Currently, investors and the public community, are concerned about a return of inflation in developed countries. They are unsettled by the rapid pace of money printing by central banks.

The scientific basis of such inflation fears is known as the “quantity theory of money.” It is a fairly old paradigm, but one that assumes that neither the general level of output in an economy nor the velocity of money changes much (1). In today’s reality, however, this assumption is invalidated by the fact that the velocity of money is very much changing, and changing significantly. Since its peak in 2007, for example, the velocity of M1 money has declined by more than 60%, while the velocity of MZM has halved, ensuring that prices have risen less than the Federal Reserve intended.

The sharp increase in the money supply has to do with quantitative easing programs: When a central bank buys bonds, the sellers receive cash. This cash, unlike bonds, is included in the money supply calculation, so the increase in the money supply is a logical consequence. However: the velocity of money in circulation will decrease by the same amount as long as this money remains buried in bank accounts. To create inflation, it must find its way into actual purchasing decisions. And therein lies the disconnect between quantity theory and practice: as central banks found out back in the years after the great financial crisis of 2008-2009, quantitative easing programs are effective in providing liquidity to capital markets, but they cannot stimulate demand in the real economy. As a result, central banks quickly felt helpless in their attempt to create inflation2 as the velocity of money simply shrank in response to the increased money supply, neutralizing most of the desired effect.
What causes inflation?
There are several competing and, of course, interconnected theories to explain and possibly predict inflation. Broadly, these explanations fall into three camps:
1) Monetarism – inflation is caused by too much growth in the money supply.
2) Supply-side access – it is caused by rising prices for inputs in the economic cycle, such as commodities or wages
3) Demand-side access – high growth leads to capacity constraints and resource scarcity, which then subsequently causes rising prices
Beyond examining these mechanisms, central banks also closely monitor inflation expectations. After all, once the expectation of rising prices is embedded in the thinking and behavior of economic agents, it easily becomes the proverbial self-fulfilling prophecy.
No sustainable increase in the immediate future
When the world enters a broadly synchronized recovery from this year’s deep recession in 2021, we will very likely see a temporary rise in inflation metrics. Beyond that, however, none of the ways we have described allow us to forecast a sustained rise in inflation over the next 2-3 years. Let us consider the three theories in turn.
Approach 1, monetarism: We have already shown that the link between money supply and inflation has been effectively short-circuited by the banking sector.
Sources: Bloomberg, OECD, Lansdowne Partners Austria
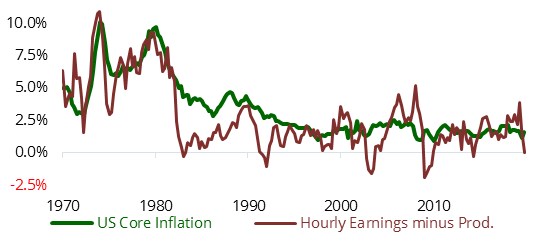
Approach 2, the supply-side argument, is often cited as the driving force behind the inflation of the 1970s. At that time, unions had considerable bargaining power and pushed through large annual wage increases, perhaps leading people to anticipate inflation. Economists identified a “wage-price spiral.” In contrast, in today’s environment, wages are unlikely to rise significantly until unemployment returns to pre-recession levels. Figure 1 shows that hourly wages have in any case not signaled inflationary pressures so far.
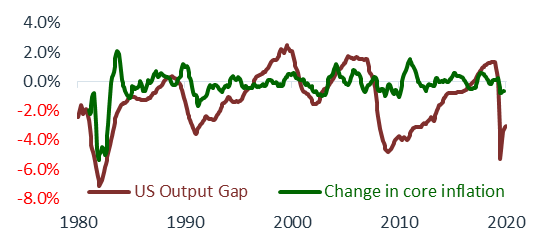
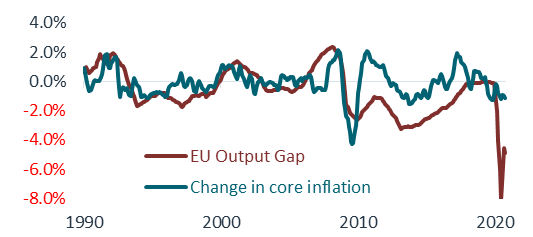
Following the third approach, it is difficult to diagnose inflation-relevant capacity constraints as long as economic growth is very far below its longer-term trend. Charts 2 and 3 show that in the past, whenever the output gap4 has been negative, inflation has generally trended downward rather than upward:
Source: Bloomberg, OECD, Lansdowne Partners Austria
Source: Bloomberg, OECD, Lansdowne Partners Austria
Finally, both market-based and survey-based inflation expectations currently remain at a stable low level.
Notwithstanding this outlook, which in itself is not a cause for concern, there is one short-term effect worth mentioning: From spring 2021, we expect base effects from volatile energy prices. The average price of crude oil (WTI) was around $17 in April 2020; today we are around 170% higher. This means that if prices continue to rise, and even if such price increases are only marginally passed through to consumers, we could see headline price increases of 3% or above in the US in April 2021. You can be sure that some journalists will pick up on this, and it will be interesting to see how the bond market reacts then. Nonetheless, we expect this rise in inflation to be temporary.
The role of fiscal policy
Unfortunately, there are still longer-term drivers of inflation that could change the dynamics so far. In fact, we see an inflation storm on the horizon. To explain, let’s briefly discuss the role of fiscal policy in the current economic situation.
The economic crisis of 2020 is fundamentally different from all previous crises in one aspect: This time, the recession is the result of a conscious decision by governments. It was decided that it is better for society as a whole to accept a recession now than to deal with the consequences of mass death due to an exponential increase in infections later. In this situation, many people are now relying on “helicopter money” to continue paying their bills. Without the many fiscal programs, the world would probably look different today. Remember, as we have said before, central banks cannot create demand. They can only prevent liquidity shortages and lower the cost of borrowing. Real demand, on the other hand, is created when a government spends money or sends it to citizens – and it doesn’t matter much, by the way, whether this is done by cutting taxes or by sending checks to citizens. To that extent, we now have a highly effective cocktail of control measures governing our economies that has worked extraordinarily well to stabilize an extremely difficult situation. This combined approach of monetary policy measures and fiscal rescue packages has already been dubbed “monetary policy 3.0″6.
To put it bluntly: We agree with this approach for now. The question is, what will happen when the economy recovers? We worry that it may be much more difficult for elected politicians to remove fiscal stimulus than it is for central banks to raise interest rates. It creates an awkward tradeoff between trying to get reelected and the imperative of not letting the economy overheat. Two observations make this tradeoff particularly uncomfortable:
a) In the case of inflation, there are particularly long lags between cause and effect. An interest rate decision today usually affects inflation a year later, or even further in the future. The fiscal policy management component, to be successful, should also be used countercyclically. In this respect, there is a risk that politicians, in constant competition for short-term popularity, will shy away from taking timely measures against inflation.
b) Second, the political spirit is being increasingly hijacked by the phenomenon of public outrage. Mass protests are on the rise in many regions of the world, empowering populists and creating friction in the fabric of society. Between 2009 and 2019, such demonstrations of public displeasure increased by about 11% annually worldwide. We must also expect this trend to continue, driven by migration to large cities, improved access to education and social media, rising youth unemployment, increasing inequality, and justified concerns about corruption and climate change (7). Against this backdrop, will policymakers give the highest priority to longer-term inflation risks?
Demographic trends
Finally, it is worth noting that the disinflationary trends of the past 40 years have been driven, at least in part, by demographic developments. The United Nations Population Database tracks the size of the different strata of the age pyramid over time. There are three major cohorts: the young (0-19 years), the working-age (20-65 years), and the old (65+). The relative size of these population cohorts can be predicted with great accuracy for at least the next 10-20 years (since these people have already been born).
What does this have to do with inflation, you might ask? Well, in general, the young and the old segments of society contribute little to the production of goods or provision of services in an economy. They consume what is provided by the working-age population. The theory, therefore, assumes that if the working-age cohort grows more rapidly than the number of people dependent on it, the economy as a whole is subject to a disinflationary force. The opposite trend-greater growth in the young and old portions of the population-will, therefore, be inflationary. Exhibits 4-7 are intended to illustrate this point: The “dependency ratio” shown there is simply the ratio of the sum of persons aged 0-19 and 65+ per 100 residents aged 20-64. We compare this ratio to the average inflation rate over the next 5 years. While the relationship that emerges cannot, of course, explain inflation on its own, it is strong enough to be included in our thinking about what might lie ahead.
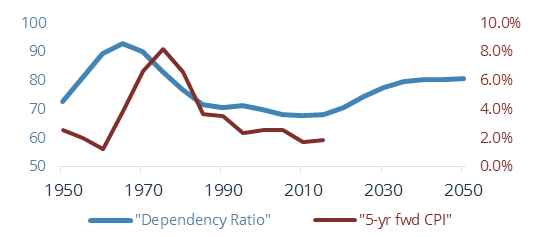
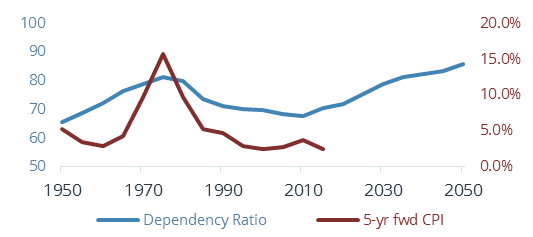
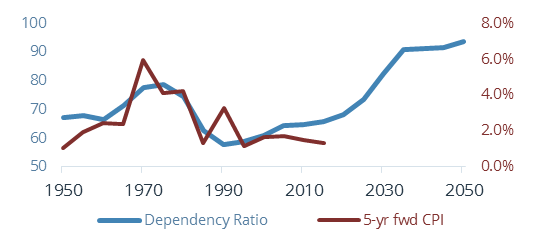
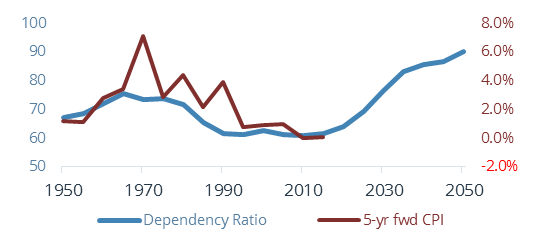
Note: Looking ahead over the next 10 years, the dependency ratio is expected to increase between 7 and 14 percentage points for the countries shown here (and, based on the average of the G7 nations, historically for every percentage point increase in the dependency ratio, the 5-year average CPI has increased by 0.27%).
Conclusion
In summary, we stand by our assessment – as already elaborated on earlier – that inflation is likely to be more of a medium- to long-term risk than an imminent problem. Nevertheless, given the perspective outlined, it is increasingly important to consider how a rise in inflation is likely to affect the various components of a portfolio in the coming years. We expect that highly valued (U.S. equities, technology) and nominal assets (high credit quality corporate and government bonds) will be most affected, which real assets, as well as assets whose cash flows or payout profiles are directly or indirectly linked to inflation, should either hold up better or even benefit.
1 Company whose business models benefit directly from lockdown measures. Examples include Zoom (video conferencing), Peloton (remote workout), or Netflix (movie streaming).
2 In monetary economics, the relationship between money supply and inflation is captured by the so-called quantity equation MV≡PY, where M = money supply, V = velocity of money, P = price level, and Y = GDP. If V and Y are approximately constant, M and P must be directly proportional.
3 In a modern economy, a 0% rate of price inflation is immediately undesirable for several reasons. Therefore, a target of 2.0% is generally formulated but has been missed. In the euro area, for example, prices on this basis have risen 8.5% less than they should since 2010.
4 The output gap is a broad measure of capacity utilization that central banks and economists like to use. It attempts to measure the extent to which the level of activity in an economy is above or below its long-term potential.
5 Smoothed presentation (based on 3-month average).
6 For comparison, under “Monetary Policy Version 1.0,” central bank policy was conducted only by raising and lowering interest rates, while Policy 2.0 included additional quantitative easing measures.
7 For a detailed discussion, see “The Age of Mass Protest,” published by CSIS in March 2020: https://www.csis.org/analysis/age-mass-protests-understanding-escalating-global-trend
Martin Friedrich is portfolio manager of the Lansdowne Endowment Fund and Head of Research. He joined Lansdowne Partners Austria in January 2019 from HQ Trust, one of the largest independent multi-family offices in Germany. Mr. Friedrich had been employed there since 2009, most recently as Head of Capital Markets Research and Co-Chief Investment Officer. Additionally, he managed client portfolios and was responsible for the investment process of LIQID, a fintech company in Berlin.
Link to Lansdowne Partners Austria GmbH: https://www.lansdownepartners.com/austria
2 thoughts on “FUND BOUTIQUES & PRIVATE LABEL FUNDS: Inflation & Fiscal Policy– Simbabwe ante portas? (Martin Friedrich, Lansdowne Partners Austria GmbH)”